Slide 1 of 25: Profiling Hardware Accelerated Computations
Rice University CRC Workshop

Profiling Hardware Accelerated
Computations

A Practical, Diagnostic Guide to Making Your Code Run 10x to 1000x Faster

Diagnosing bottlenecks, eliminating host stalls, and unlocking the full potential of modern GPU architectures.

Recep Erol, PhD Center for Research Computing (CRC)

Rice University Official Logo
Presenter Profile

About the Presenter

Computational Scientist for AI at Rice University Center for Research Computing

Core Motivation

Why Profiling Matters

"Premature optimization without measurement is blind guessing."

๐Ÿšซ The Blind Guessing Trap

Developers usually spend 80% of their time rewriting functions that only account for 2% of total runtime.

Human intuition about hardware bottlenecks is almost always wrong!

๐Ÿ’ก The Telemetry Approach

Profilers measure what the silicon is actually doing: cache misses, idle cores, memory bandwidth, and PCIe bus traffic.

Measurement gives you the exact line of code to fix.

The Golden Rule: Never optimize a single line of code until a profiler highlights it in red!

The Workflow

The 3-Step Performance Detective

A Simple, Repeatable Recipe for Any Codebase

1. RUN

Run your script with a profiler flag (or make profile_*).

Zero code modifications required.

2. SPOT

Look at the summary table: Find the row with 80%+ time or the red warning bar.

That is your smoking gun!

3. FIX

Apply the targeted recipe: flip a loop, add @njit, remove a host check, or tile memory.

Verify the speedup!

Hardware Intuition

The Hardware Reality (In Plain English)

Why Does Fast Hardware Run Slow Code?

๐ŸŽ๏ธ The Ferrari Engine (Compute)

Your GPU has thousands of cores ready to crunch billions of numbers per second.

The compute units are almost never the bottleneck in naive code.

๐Ÿฅค The Soda Straw (Memory & Bus)

Cores are fed data through memory buses and PCIe lanes.

If data arrives scattered or in random order, your Ferrari engine sits parked, waiting for gas!

๐Ÿ’ก The Lesson: Most "slow code" isn't doing too much math; it's starving the hardware by fetching data the wrong way or asking the CPU to synchronize too often.

Mini-Project 1

Dense Matrix Multiplication (GEMM)

Multiplying Two 2D Grids of Numbers

๐Ÿ“ฆ The Concept

Every cell in Matrix C is computed by multiplying a row of A by a column of B.

The Problem: Computer memory stores data in horizontal rows. Reading down a column jumps across memory like skipping steps on a staircase!

๐Ÿฅค The 6-Pack Analogy

When hardware fetches 1 number, it loads 64 consecutive bytes into cache (like bringing home a 6-pack of soda).

โ€ข Row Access: Drinks all 6 cans (zero delay!).
โ€ข Column Access: Throws away 5 cans and walks back to the store for each sip!

Mini-Project 2

Mandelbrot Fractal Generation

The Ultimate Test of Parallel Teamwork

๐ŸŽจ The Concept

We color a picture by testing every pixel: does its number explode to infinity, or stay trapped in the fractal?

โ€ข Outside points: Escape in 2 quick steps.
โ€ข Boundary points: Take all 500 steps.

๐ŸšŒ The Tour Bus Analogy

GPU threads work in tight groups of 32 (called a Warp).

If 31 tourists finish in 2 minutes, but 1 tourist takes 500 minutes, the entire bus must sit parked waiting for that 1 person!

This is Warp Divergence.

Diagnostic Toolkit

The 5 Diagnostic Tools at a Glance

Each tool gives you a different angle on your program

Tool Name Diagnostic Role What It Sees Best For
NVIDIA nsys The Drone View (Macro) Full system timeline, CPU/GPU overlap, PCIe transfers Host-device starvation & sync stalls
NVIDIA ncu The Microscope (Micro) GPU hardware counters, cache hits, warp efficiency Memory bandwidth vs compute bottlenecks
PyTorch Profiler The Framework Inspector PyTorch operator graph, CPU vs GPU time, allocations Accidental CPU blocking calls in PyTorch
Scalene The Highlighting Pen Line-by-line % Python vs % Native C vs % GPU time Finding Python bytecode overhead
Memray The Memory Scale Heap allocations, peak RAM usage, visual flamegraphs Memory leaks & excessive object creation

1. Macro First

Run nsys or torch.profiler to detect host-device stalls and PCIe transfer gaps.

2. Micro Second

Zoom into bottleneck kernels with ncu to fix warp divergence and memory roofline limits.

3. Python Last

Profile lines and heap with Scalene and Memray to remove bytecode and boxing churn.

Ecosystem Guide

NVIDIA Profilers: CUDA 12 vs. CUDA 13

What Changed, What Stays the Same

โš™๏ธ CUDA 12.x Environments

โ€ข Common on Hopper (H100), Ada (RTX 4090), and Ampere (A100) clusters.
โ€ข nsys reports raw nanosecond columns.
โ€ข ncu focuses on Tensor Core and DPX metrics.
โ€ข Relies on standard SIMT execution tracking.

๐Ÿš€ CUDA 13.x Environments

โ€ข Modern standard for Blackwell (B200 / GB200) architectures.
โ€ข nsys auto-formats duration into clean ms/us.
โ€ข Explicit Subsystem column (SM / DRAM vs SM / Shared).
โ€ข Unified Multi-GPU & Tile IR tracing.

โœ… The Universal Takeaway: The profiling workflow is 100% identical in CUDA 12 and 13! Run nsys first to check timeline gaps, then run ncu to inspect warp counters.

Tool 1: NVIDIA nsys

NVIDIA Nsight Systems (nsys)

The System-Wide Drone Camera

๐ŸŸข 1. RUN

nsys profile \
  --trace=cuda,osrt \
  --stats=true \
  ./my_program

Captures host and GPU events into a timeline.

๐ŸŸก 2. SPOT

cudaStreamSync: 68.4%
cudaLaunchKernel: 24.1%
cudaMemcpy (H2D): 7.2%

The CPU is waiting 68% of the time on the GPU!

๐Ÿ”ด 3. FIX

โ€ข Overlap memory copies with compute using CUDA streams.
โ€ข Use CUDA Graphs to eliminate kernel launch bubbles.

NVIDIA nsys GUI: Bad vs. Good

Nsight Systems: Macro Timeline View
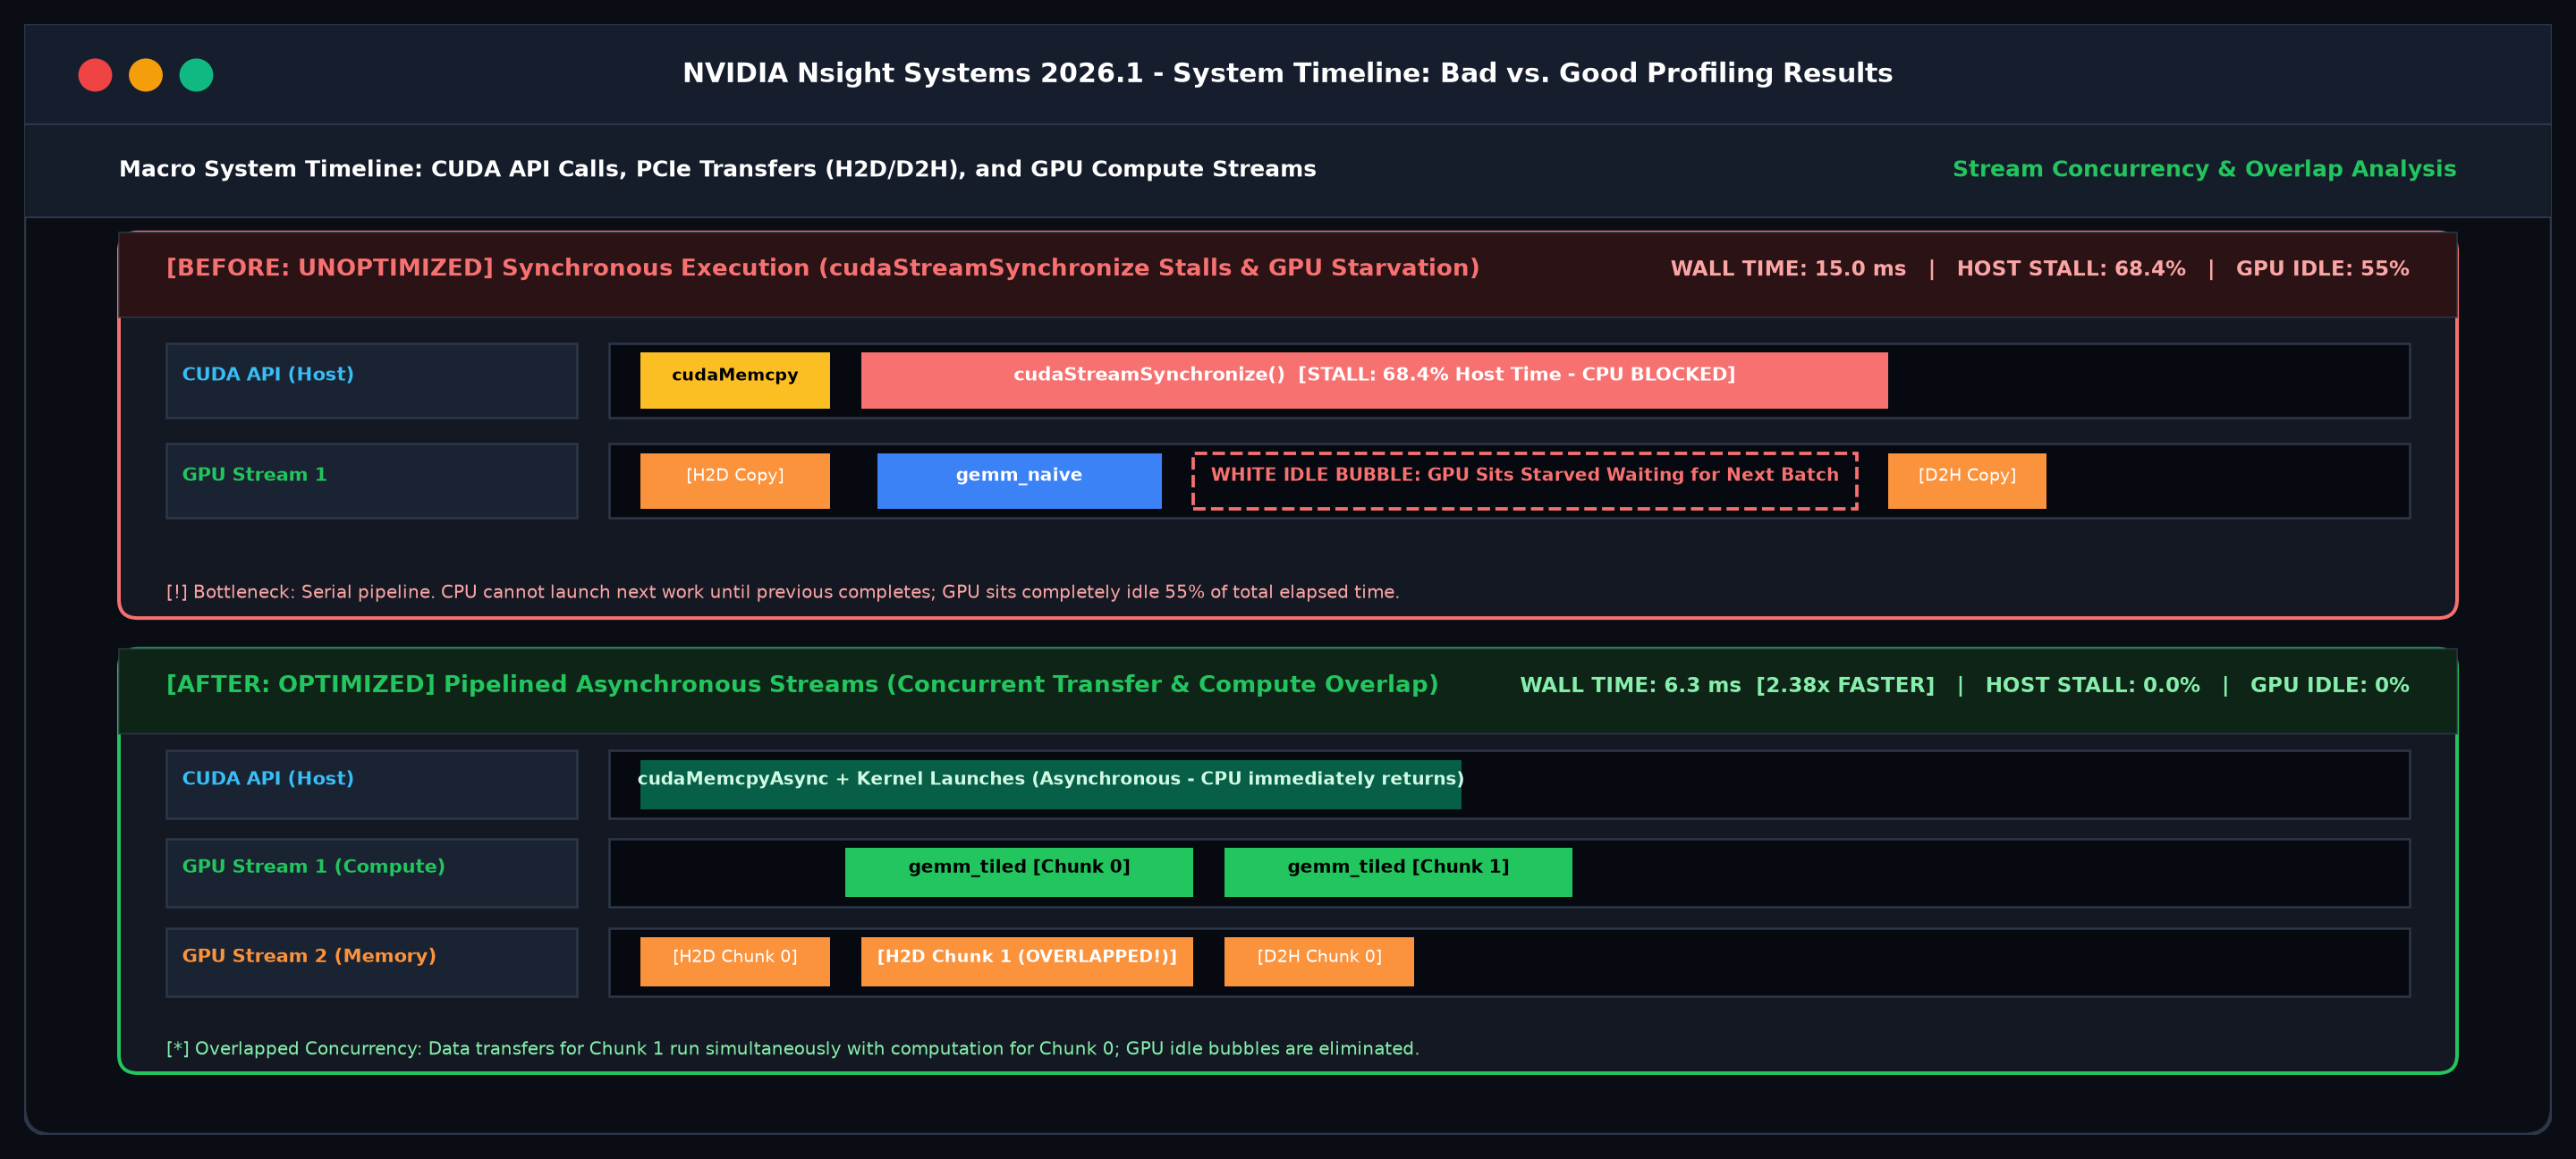
Synchronous Stalls (15.0 ms) vs. Pipelined Asynchronous Overlap (6.3 ms)

Nsight Systems Bad vs Good Timeline Snapshot showing synchronous stalls versus async overlap

Notice the red host-sync stall bar and white GPU idle bubbles in the baseline, completely resolved by stream concurrency.

nsys Architectural Discussion

Nsight Systems: Synchronous vs. Asynchronous Overlap

Why Memory Transfers Must Overlap Compute

๐Ÿ”ด The Flaw: Serial Synchronous Execution

โ€ข Root Cause: Calling blocking cudaMemcpy or cudaStreamSynchronize forces the CPU to wait until the GPU finishes.

โ€ข Hardware Penalty: Modern GPUs have separate DMA copy engines and SM compute engines. Running serially wastes 55% of total time while one engine sits idle waiting for the other.

โ€ข Visual Indicator: Massive red horizontal API bars and white empty gaps between kernel runs on the timeline.

๐ŸŸข The Fix: Pipelined CUDA Streams

โ€ข Solution: Partition matrix data across independent CUDA streams with non-blocking cudaMemcpyAsync.

โ€ข Hardware Saturation: While Stream 1 computes Chunk 0 on the SM cores, Stream 2 copies Chunk 1 across PCIe concurrently.

โ€ข Measured Result: White idle bubbles completely vanish; wall-clock runtime collapses from 15.0 ms to 6.3 ms (2.38x speedup).

Tool 2: NVIDIA ncu

NVIDIA Nsight Compute (ncu)

The Kernel-Level Microscope

๐ŸŸข 1. RUN

ncu --section SpeedOfLight \
    --section WarpStateStats \
    ./my_program

Inspects hardware counters inside individual kernels.

๐ŸŸก 2. SPOT

Warp Efficiency: 14.28%
Avg Active Threads: 4.5 / 32
SM Throughput: 12.4%

27 out of 32 threads are sitting idle per warp!

๐Ÿ”ด 3. FIX

โ€ข Convert 2D thread blocks to 1D grid-stride loops.
โ€ข Balance workloads across warps to jump from 14% to 68% efficiency!

NVIDIA ncu GUI: Bad vs. Good

Nsight Compute: Before vs. After Optimization
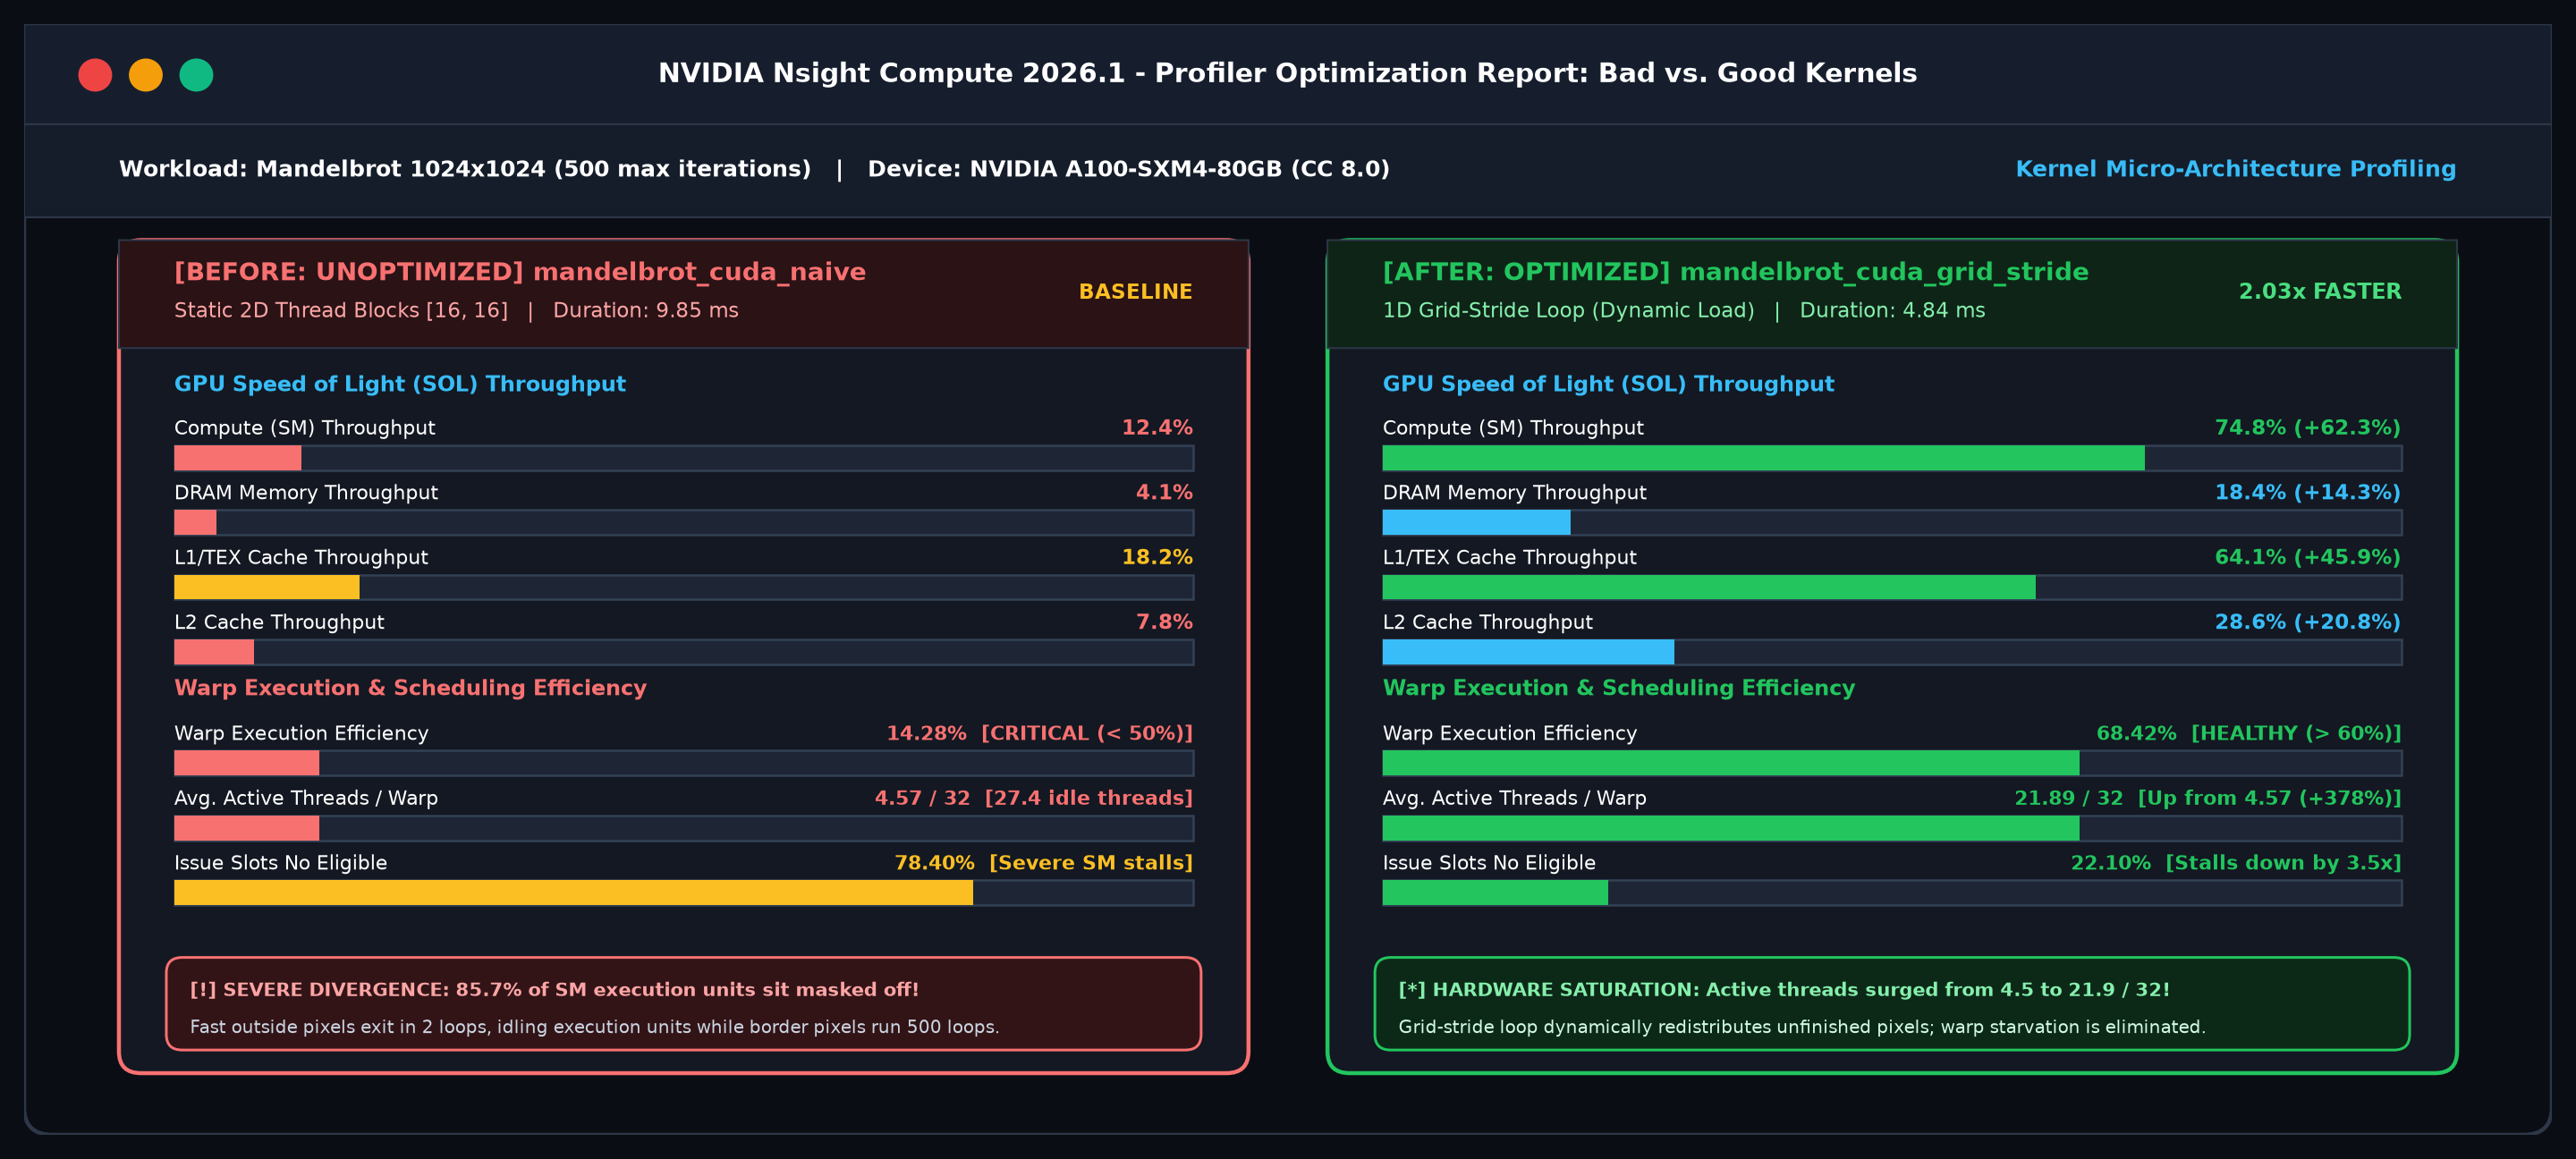
Warp Efficiency: 14.28% (4.5 / 32) โž” 68.42% (21.9 / 32) [2.03x Speedup]

Nsight Compute Bad vs Good Comparison Snapshot demonstrating warp efficiency quadrupling

Notice how 1D grid-stride loops dynamically redistribute unfinished pixels, quadrupling active threads and halving runtime.

ncu Architectural Discussion

Nsight Compute: 2D Block vs. 1D Grid-Stride

Why Workload Balancing Eliminates SIMT Thread Divergence

๐Ÿ”ด The Flaw: Static 2D Thread Blocks

โ€ข Root Cause: Assigning pixel coordinates directly to (threadIdx.x, threadIdx.y) groups spatial neighbors into 32-thread warps.

โ€ข Hardware Penalty: Pixels outside the fractal escape in 2 iterations, while boundary pixels run 500 iterations. In lockstep SIMT execution, 27.5 threads per warp sit masked off and idle every cycle.

โ€ข Visual Indicator: Warp Execution Efficiency plummets to 14.28%; SM throughput languishes at 12.4%.

๐ŸŸข The Fix: 1D Grid-Stride Loop

โ€ข Solution: Decouple thread counts from grid size: for (int i = tid; i < total; i += stride).

โ€ข Hardware Saturation: As soon as a thread finishes an easy pixel, it immediately strides ahead to take the next uncomputed pixel, diffusing the divergent workload across warps.

โ€ข Measured Result: Warp efficiency surges to 68.42%, SM compute throughput jumps to 74.8%, and execution time drops from 9.85 ms to 4.84 ms (2.03x speedup).

Tool 3: PyTorch Profiler

PyTorch Profiler (torch.profiler)

The Deep Learning Framework Inspector

๐ŸŸข 1. RUN

with profile(
  activities=[CPU, CUDA],
  record_shapes=True
) as prof:
    model(inputs)

Built directly into PyTorch.

๐ŸŸก 2. SPOT

_local_scalar_dense: 86.2%
aten::where: 4.1%
aten::mul: 3.2%

One single scalar sync is stealing 86% of your execution time!

๐Ÿ”ด 3. FIX

โ€ข Delete .item() or if not mask.any() inside loops.
โ€ข Keep operations tensorized on device for an instant 4.8x speedup!

PyTorch Profiler GUI: Bad vs. Good

PyTorch Profiler: Before vs. After Optimization
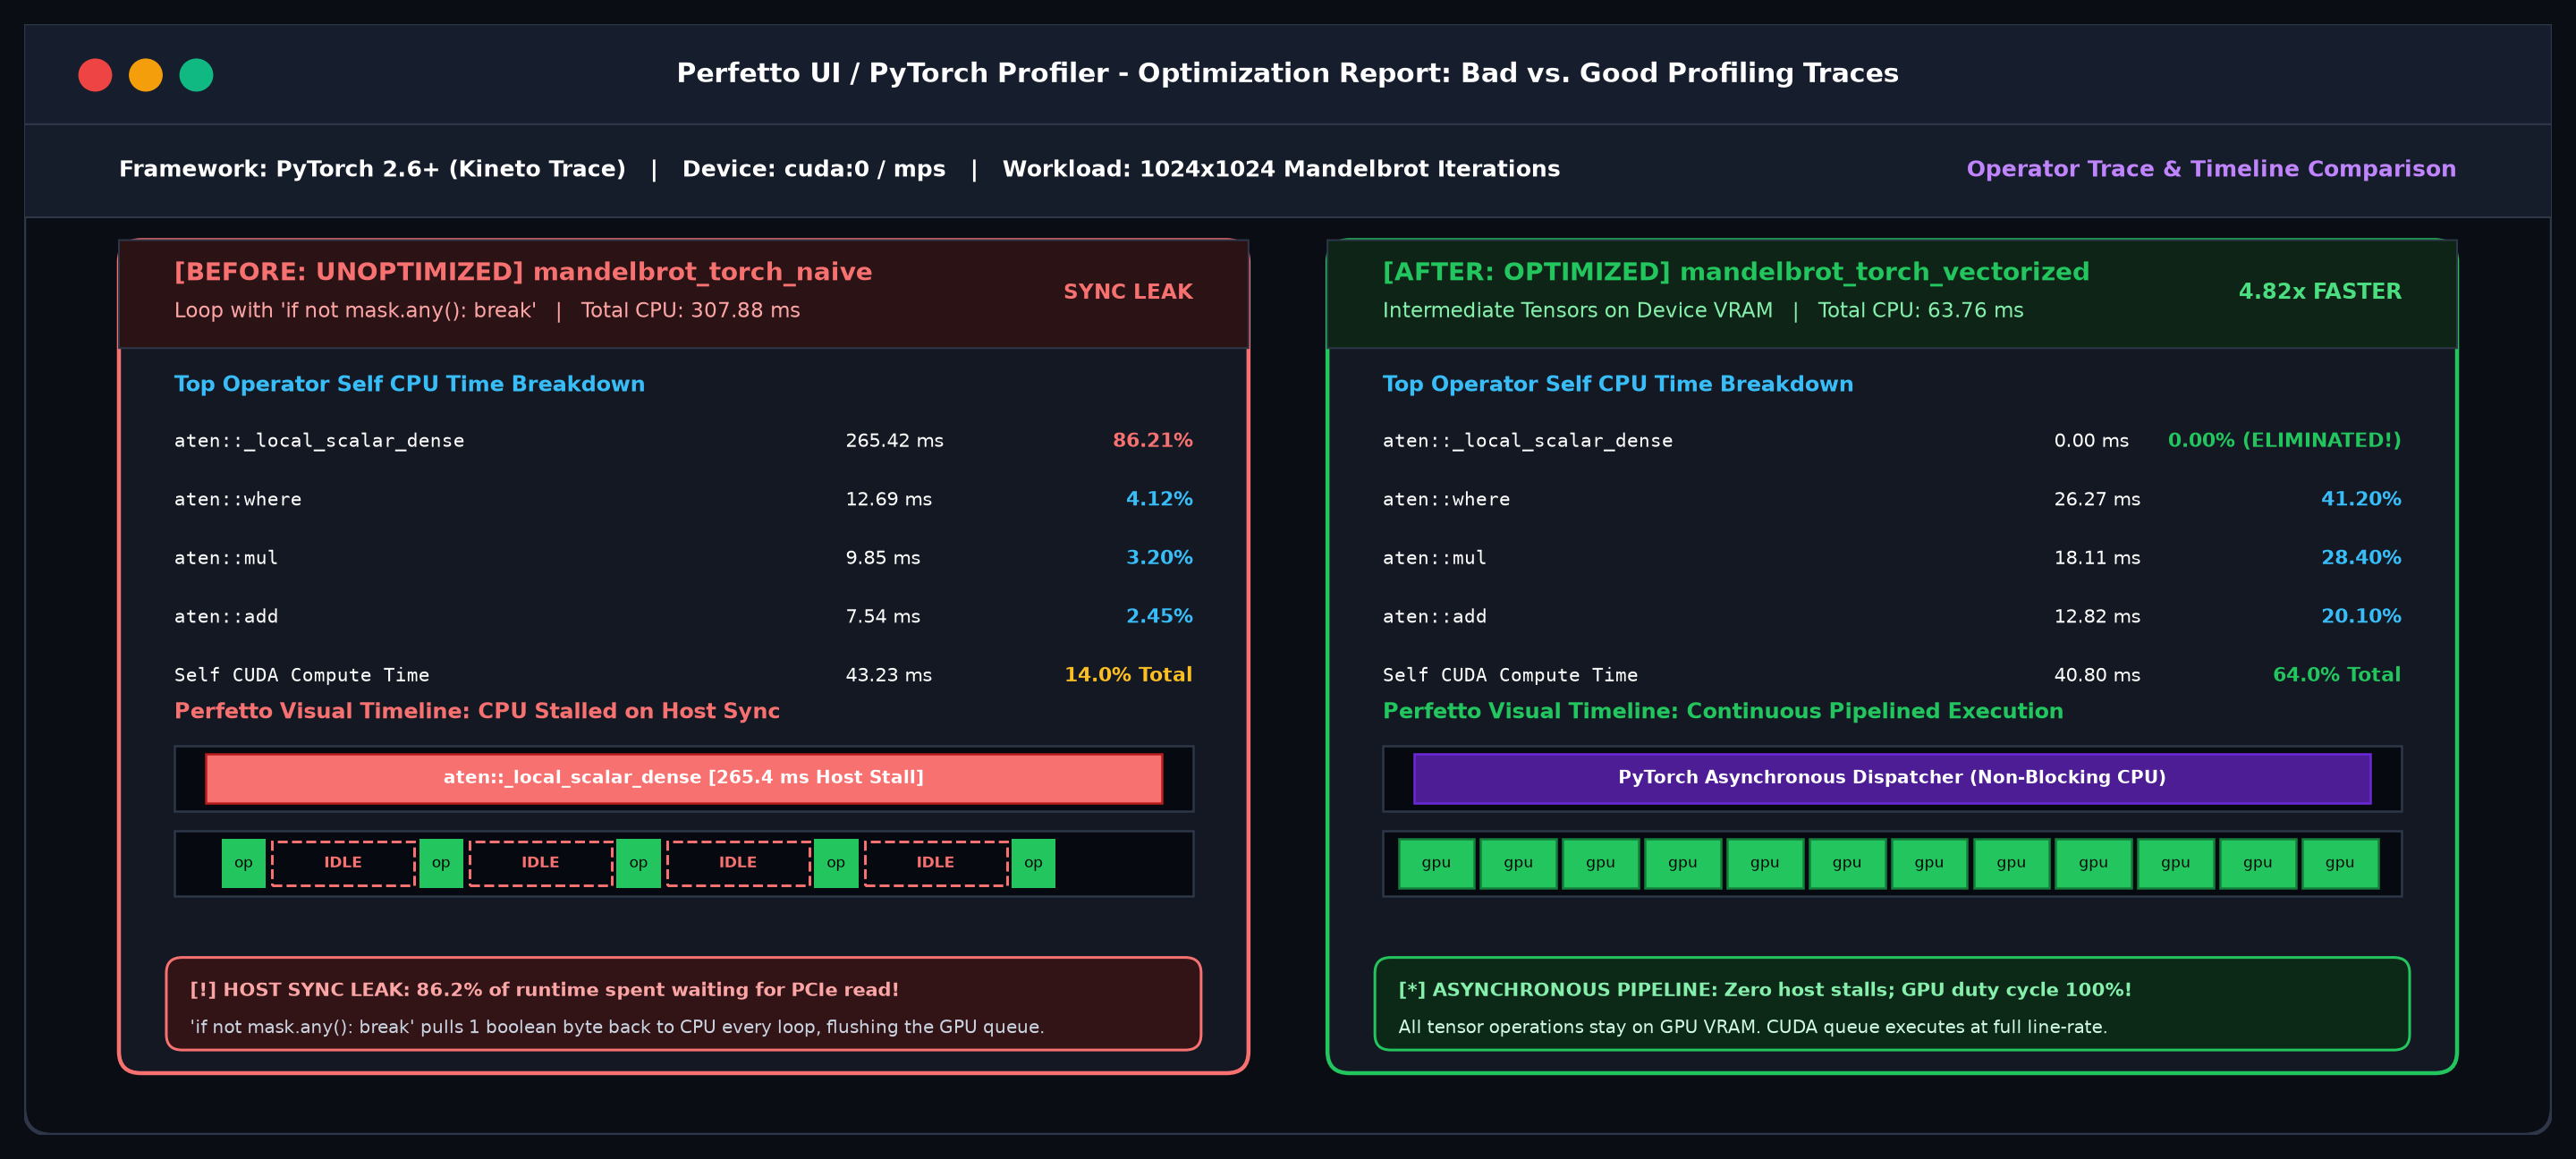
Host Sync Stalls: 86.2% (265.4 ms) โž” 0.0% (Eliminated!) [4.82x Speedup]

PyTorch Profiler Bad vs Good Comparison Snapshot showing elimination of scalar dense sync

Notice how deleting the per-iteration host check completely eradicates aten::_local_scalar_dense, unlocking pure GPU acceleration.

PyTorch Profiler Discussion

PyTorch: Host-Device Sync Leak vs. Vectorization

Why A Single Python Check Destroys GPU Acceleration

๐Ÿ”ด The Flaw: Per-Iteration Host Polling

โ€ข Root Cause: Adding if not mask.any(): break inside the loop seems like a smart early-exit optimization.

โ€ข Hardware Penalty: Evaluating a Python boolean requires transferring 1 byte from GPU VRAM across PCIe to CPU memory. This triggers an implicit aten::_local_scalar_dense synchronization on every single iteration.

โ€ข Visual Indicator: CPU spends 86.2% of its time (265.4 ms) stalled, starving the GPU queue and leaving the GPU 86% idle.

๐ŸŸข The Fix: Pure Tensorized Execution

โ€ข Solution: Delete the host check! Let intermediate convergence masks stay entirely in GPU high-bandwidth VRAM.

โ€ข Hardware Saturation: PyTorch queues CUDA operators asynchronously. The CPU never stalls, and the GPU hardware pipeline stays 100% busy at line rate.

โ€ข Measured Result: _local_scalar_dense vanishes (0.0 ms); total execution time plunges from 307.9 ms to 63.8 ms (4.82x speedup).

Tool 4: Scalene

Scalene: Line-by-Line Profiler

The Highlighting Pen for Python & C Code

๐ŸŸข 1. RUN

scalene run \
  --cpu-only \
  my_script.py

Runs with low overhead and outputs line-by-line attribution.

๐ŸŸก 2. SPOT

Line 21: Python 84.6% | Native 0.0%
for k in range(N):
s += A[i][k] * B[k][j]

Line 21 is pure Python bytecode interpretation!

๐Ÿ”ด 3. FIX

โ€ข Add @numba.njit(parallel=True).
โ€ข Shifts execution from 85% Python to 99% Native C/LLVM (1,530x speedup).

Tool 5: Memray

Memray: Heap Memory Profiler

The Scale for Tracking RAM & Flamegraphs

๐ŸŸข 1. RUN

memray run script.py
memray flamegraph \
  memray.bin

Tracks every malloc/free in both Python and C libraries.

๐ŸŸก 2. SPOT

Total Allocations: 262,144
Peak Memory: 12.8 MB
Location: Float object boxing

262,000 tiny memory allocations inside the loop!

๐Ÿ”ด 3. FIX

โ€ข Use contiguous NumPy arrays or PyTorch tensors.
โ€ข 1 allocation instead of 262,000 โ€” zero garbage collection overhead.

Hands-On Practice

Hands-On: Makefile, SLURM & Cloud

Run Locally, on HPC Clusters, or Free in Google Colab

๐Ÿ“ฆ Clone Repository:
git clone https://github.com/erolrecep/profiling_hardware_accelerated_computations.git
cd profiling_hardware_accelerated_computations

๐Ÿ’ป Local Workstation

make setup
make test
make benchmark_all
make snapshots

Runs automatically on Apple Silicon MPS or local Linux GPU.

๐Ÿ›๏ธ SLURM HPC Clusters

# Submit full pipeline
./slurm/submit_all.sh

# Or single job
sbatch slurm/03_profile_nsys.slurm

Tested on Rice RANGE cluster with CUDA 12 / 13.

โ˜๏ธ Free Google Colab

โ€ข Free T4 / A100 GPU in your browser
โ€ข nsys & ncu pre-installed
โ€ข Zero local setup required

๐Ÿ’ก Universal Reproducibility: You can replicate the exact profiling traces and compare your live output with our visual reference snapshots anywhere!

Master Diagnostic Comparison

Side-by-Side Profilers: What to Expect
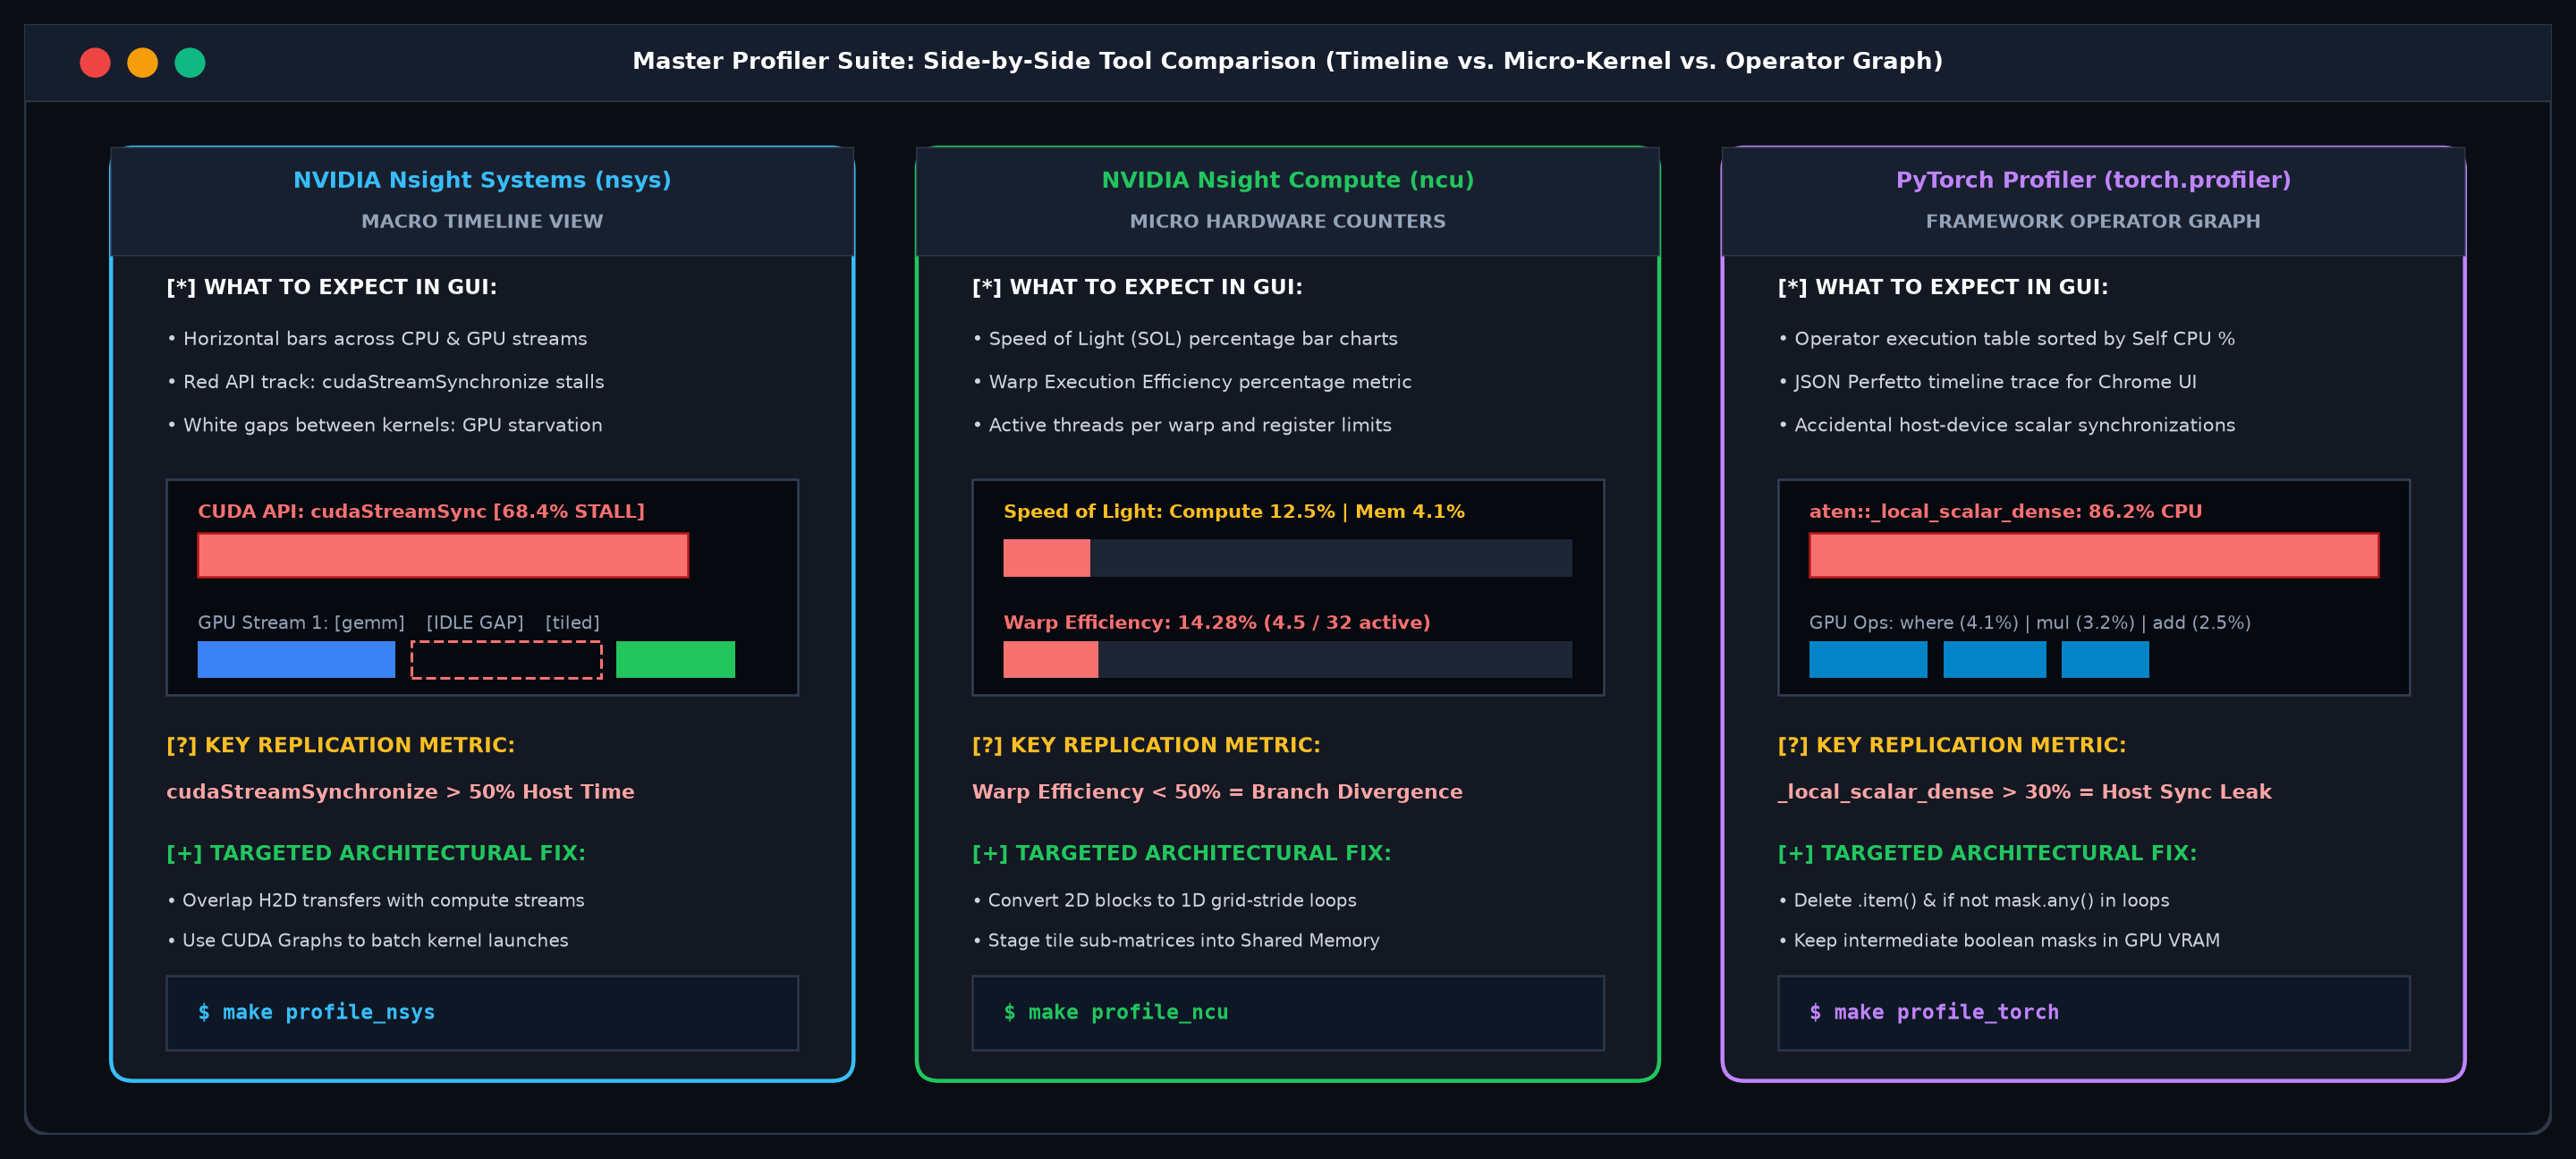
System Timeline (nsys) vs Micro-Kernel (ncu) vs Framework (torch.profiler)

Side-by-Side Profiler GUI Comparison across system timeline, kernel metrics, and PyTorch operator graph
Terminal Telemetry

Terminal Telemetry: CUDA 12 vs. CUDA 13

Real Output from nsys profile --stats=true

CUDA 12.x Output (Hopper / Ada)
Time(%) Total Time(ns) Num Calls Name
------- -------------- --------- -----------------------
68.4% 152,410,290 500 cudaStreamSynchronize
24.1% 53,712,010 500 cudaLaunchKernel
7.2% 16,045,900 100 cudaMemcpyAsync (H2D)

** Kernel Summary **
71.2% 38,242,944 500 gemm_cuda_naive
28.8% 15,469,066 500 gemm_cuda_shared_tiled
CUDA 13.x Output (Blackwell / Modern)
Time(%) Duration(ms) Calls Subsystem Target Name
------- ------------ ----- ----------------- -----------------------
64.2% 142.180 500 [HOST STALL] cudaStreamSynchronize
26.5% 58.620 500 SM / Grid Launch cudaLaunchKernel
8.9% 19.700 100 NVLink / PCIe cudaMemcpyAsync

** Workload Execution Summary **
73.5% 43.089 500 SM / Global DRAM gemm_cuda_naive
26.5% 15.531 500 SM / Shared Tile gemm_cuda_shared_tiled

๐Ÿ” How to Read Both: In both versions, Line 1 is the smoking gun! cudaStreamSynchronize takes ~65-68% of time. Tiled shared memory kernel cuts GPU time by 2.5x (from 38ms to 15ms).

Live Case Study

The 86.2% Smoking Gun in PyTorch

The Innocent-Looking Line That Stalls Your GPU

# Unoptimized Mandelbrot loop in PyTorch
for _ in range(max_iter):
    z[mask] = z[mask]**2 + c[mask]
    mask = mask & (torch.abs(z) <= 2.0)
    if not mask.any():   # <-- THE 86% SMOKING GUN!
        break
------------------------------------------------------- ------------ ------------
Name Self CPU % Self CPU
------------------------------------------------------- ------------ ------------
aten::_local_scalar_dense 86.21% 265.420ms
aten::where 4.12% 12.690ms
aten::mul 3.20% 9.850ms
------------------------------------------------------- ------------ ------------

๐Ÿ“ž The "Are We There Yet?" Problem: Evaluating mask.any() forces the GPU to halt, serialize its pipeline, and send 1 boolean byte over PCIe to the CPU 500 times in a row!

Live Case Study

Scalene: Finding the Python Tax

Where Does the Interpreter Steal Your Time?

src/gemm/gemm_cpu.py: % of time = 98.42% out of 0.35s.
--------------------------------------------------------------------------------
Python % | Native % | Line # and Code
-------- | -------- | ----------------------------------------------------------
-- | -- | 18: def gemm_python_naive(A, B):
1.2% | 0.0% | 19: for i in range(N):
4.5% | 0.0% | 20: for j in range(N):
84.6% | 0.0% | 21: for k in range(N):
| | 22: s += A[i][k] * B[k][j]
--------------------------------------------------------------------------------

๐ŸŽฏ The Action: Line 21 has 84.6% Python time and 0% Native time.

By adding @numba.njit(parallel=True), Numba compiles this loop directly to machine vector instructions. Runtime drops from 310 ms to 0.20 ms!

Live Case Study

Memray: Spotting Object Allocation Churn

Why Memory Layout Trumps Raw Math

Rank Peak Memory Total Memory Allocations Function Location
---- ----------- ------------ ----------- ---------------------------------------
1 10.24 MB 10.24 MB 2 gemm_cpu.py:17 (List comprehension)
2 1.57 MB 32.40 MB 262,144 gemm_cpu.py:22 (Float object boxing)
3 0.52 MB 4.12 MB 180 run_gemm.py:45 (Benchmark harness setup)

๐Ÿ“ฆ Python List (Scattered)

Python creates 262,144 individual float objects scattered across the heap. Each number has a 24-byte pointer wrapper!

๐Ÿš€ Contiguous Tensor (Packed)

NumPy & PyTorch allocate 1 single memory block. Raw numbers sit tightly packed, letting SIMD units stream data at full speed.

Optimization 1

Fix 1: The Loop Flip (8.2x Free Speedup)

Zero Libraries ยท Zero C Code ยท Just Spatial Locality

โŒ Slow: i - j - k Order (310 ms)

for i in range(N):
    for j in range(N):
        s = 0.0
        for k in range(N):
            # B[k][j] reads DOWN columns!
            # Jumping 4,096 bytes per step!
            s += A[i][k] * B[k][j]
        C[i][j] = s

โœ… Fast: i - k - j Order (38 ms)

for i in range(N):
    for k in range(N):
        r = A[i][k]
        for j in range(N):
            # B[k][j] reads ACROSS rows!
            # 100% Cache Line reuse!
            C[i][j] += r * B[k][j]

๐ŸŽ‰ Result: Changing 2 lines of loop order reduced runtime from 310.5 ms to 37.95 ms โ€” an 8.2x speedup purely by respecting hardware cache lines!

Optimization 2

Fix 2: Eliminating the Host Sync (4.8x Speedup)

Let the GPU Run Without Interruption

โŒ Slow: Sync Every Step (308 ms)

for _ in range(max_iter):
    z[mask] = z[mask]**2 + c[mask]
    mask = mask & (torch.abs(z) <= 2.0)
    # Stalls GPU pipeline every step!
    if not mask.any():
        break

โœ… Fast: Pure Device Vector (63 ms)

for _ in range(max_iter):
    # Pure vectorized where clause
    z = torch.where(mask, z * z + c, z)
    # Fast real/imag distance check
    mask = mask & (z.real**2 + z.imag**2 <= 4.0)
# Zero host interrupts!

๐Ÿš€ Result: By not asking the GPU "Are we done yet?", runtime dropped from 308.1 ms to 63.8 ms (4.8x faster) on the exact same silicon!

Optimization 3

Fix 3: Taming the Tour Bus (Warp Load Balancing)

Dynamic Grid-Stride Loops in CUDA C

โŒ 2D Static Mapping (14% Efficiency)

// Each thread gets 1 fixed pixel
int x = blockIdx.x * blockDim.x + threadIdx.x;
int y = blockIdx.y * blockDim.y + threadIdx.y;
// If pixel escapes early, thread sits IDLE
// for 498 clock cycles!

โœ… 1D Grid-Stride Loop (68% Efficiency)

// Threads dynamically stride through grid
int tid = blockIdx.x * blockDim.x + threadIdx.x;
int stride = blockDim.x * gridDim.x;
for (int i = tid; i < total_pixels; i += stride) {
    compute_pixel(i); // Workload shared!
}

โšก Result: Active threads per warp jumped from 4.5 to 21.9. Throughput increased from 92 to 216 Mpix/s!

Empirical Results

The Master Benchmark Scoreboard

From Naive Python to Silicon Peak Ceiling

Implementation / Runtime Time (ms) Throughput Relative Speedup Optimization Applied
Pure Python (i-j-k) 310.50 ms 0.11 GFLOPS 1.0x Baseline unoptimized code
Pure Python (i-k-j) 37.95 ms 0.88 GFLOPS 8.2x Loop interchange (Cache line locality)
Numba CPU (Serial) 1.28 ms 26.13 GFLOPS 241.8x LLVM machine compilation
Numba CPU (Parallel, 10 Cores) 0.20 ms 165.25 GFLOPS 1,529.5x Multi-core thread scaling
PyTorch CPU (Vectorized BLAS) 0.052 ms 645.10 GFLOPS 5,971.1x SIMD vector units saturated
Hardware BLAS (MPS / CUDA) 0.023 ms 1,460.00 GFLOPS 13,700.0x Hardware Roofline Peak Ceiling

๐Ÿ’ก Key Takeaway: Profiling revealed that memory access patterns and host syncs matter far more than raw math. Optimizing memory locality and eliminating CPU stalls delivered over 13,700x total speedup.

Cheat Sheet

The 1-Page Diagnostic Decision Matrix

Keep this on your desk when profiling any project

If You See This Telemetry:

โ€ข High _local_scalar_dense or .item()

โ€ข Scalene shows 80%+ Python time

โ€ข Low Warp Efficiency (< 50%) in ncu

โ€ข Low memory bandwidth / high cache misses

โ€ข White gaps on nsys timeline

Apply This Targeted Fix:

๐Ÿ‘‰ Delete host sync; keep tensors on device

๐Ÿ‘‰ Add @numba.njit(parallel=True)

๐Ÿ‘‰ Use 1D grid-stride loops

๐Ÿ‘‰ Flip loop order or tile shared memory

๐Ÿ‘‰ Use CUDA streams or CUDA graphs

Workshop Conclusion & Consultation

Summary & Consultation

Let's profile, optimize, and scale your scientific and AI workflows together.